ParquetCanopy

ParquetCanopy
Making Different Maps Work Together
Forests do not follow file formats, administrative boundaries, or coordinate reference systems. Geospatial software has to deal with all three.
A forest-risk assessment may begin with a map, but the data behind that map rarely comes from a single source. National agencies publish administrative boundaries. International organizations maintain databases of protected areas. Satellite-derived products describe forest cover through raster grids, while other datasets represent the same landscape as polygons.
Each source has its own purpose, structure, spatial reference, and definition of what it represents.
ParquetCanopy is a geospatial data service built with FastAPI, DuckDB, and Parquet. The project explores how heterogeneous geographical datasets can be organized into a queryable system for forest monitoring and deforestation-risk assessment, particularly in the context of the European Union Deforestation Regulation (EUDR).
The difficult part is not putting these datasets on the same screen. It is making them meaningfully comparable without losing the information that makes each one useful.
1.The Problem Is Not a Lack of Maps
Deforestation is a physical process, but identifying and documenting it requires information from several different systems. The Food and Agriculture Organization of the United Nations estimated that approximately 10 million hectares of forest were deforested annually between 2015 and 2020.1 Understanding where forest loss occurs, and how it relates to agricultural production and land-use restrictions, requires more than a single representation of the landscape.
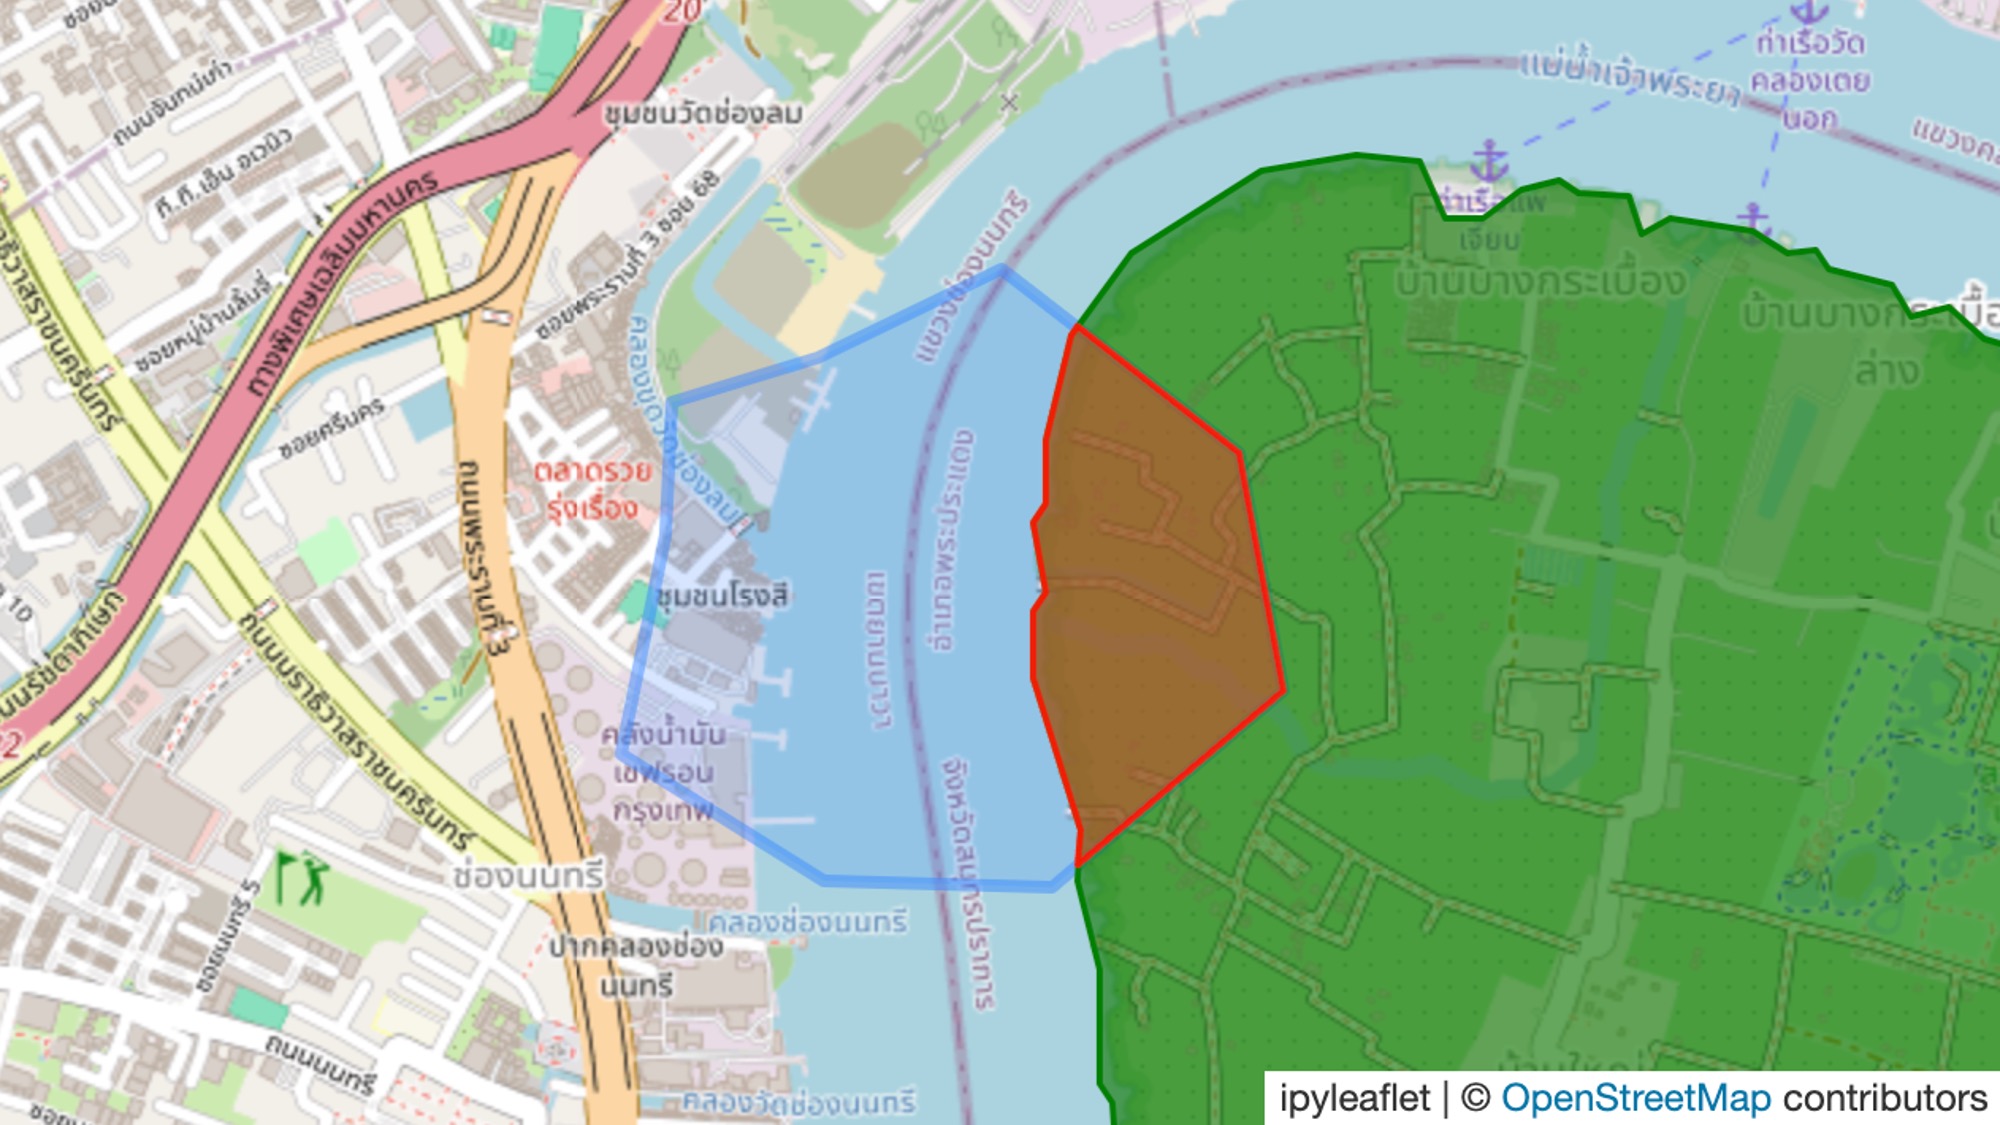
One dataset may describe forest cover. Another may identify a national park. A third may define a national reserved forest. An international database may contain a separate boundary for a protected area covering some or all of the same land. As these layers are related, but they are not interchangeable.
A national park boundary is a legal or administrative designation. A forest-cover map represents a classification of land. A protected-area database aggregates information from different jurisdictions and providers. Even where two boundaries overlap, they may represent different legal categories, source dates, or mapping methodologies.
The resulting challenge is one of geographical interoperability: determining how to work with these representations together while preserving their differences. The objective is not to make every dataset identical. It is to make their differences explicit and their relationships computable.
2.EUDR: From Commodity Supply Chains to Geographical Evidence
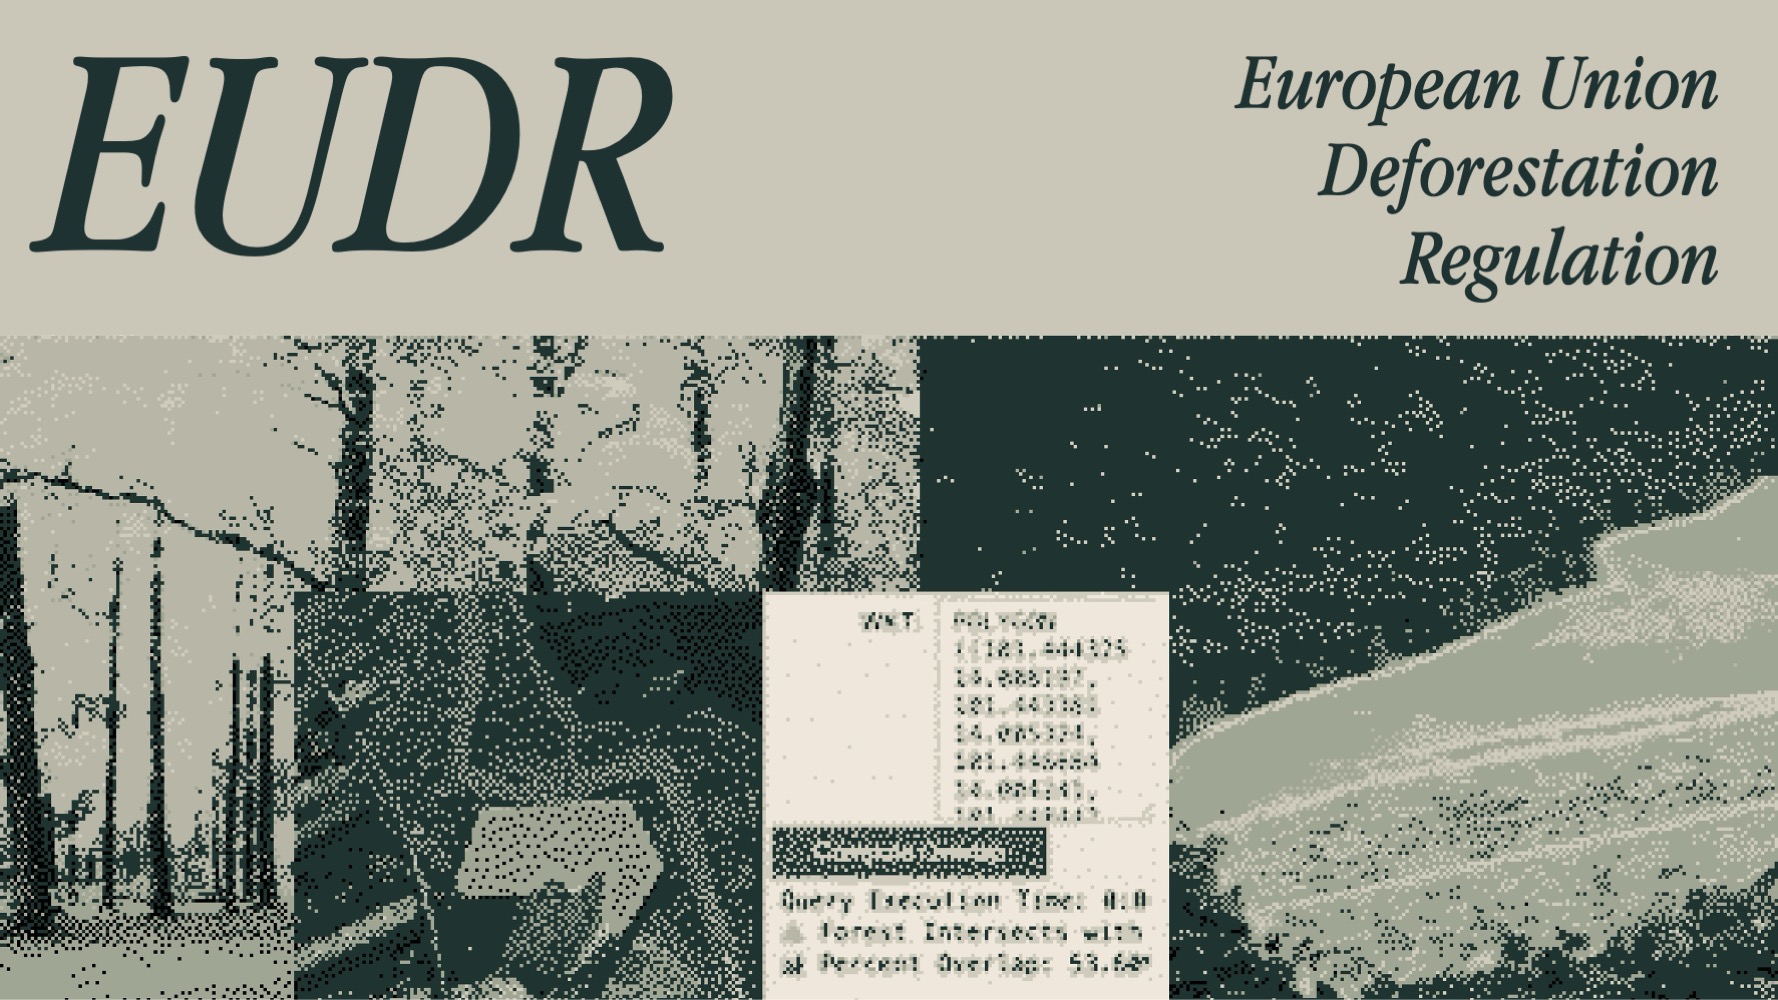
The European Union Deforestation Regulation, formally Regulation (EU) 2023/1115, addresses the relationship between commodity supply chains and deforestation. It covers cattle, cocoa, coffee, oil palm, rubber, soy, and wood, together with specified products derived from them.2
The regulation requires relevant products placed on the EU market or exported from it to satisfy deforestation-free and legality requirements, supported by due diligence.
Geography is central to this process. Operators must collect geolocation information for the plots of land where relevant commodities were produced. The regulation’s definition of deforestation-free uses a cutoff date of 31 December 2020.2
These requirements turn a seemingly simple question – where was this commodity produced? – into a geographical investigation.
A production plot can be compared with forest-cover data, historical land-cover observations, and relevant protected-area boundaries. Those comparisons can help identify locations requiring additional investigation.
However, the presence of a plot inside a mapped forest or protected area does not automatically establish an EUDR violation. Nor does its absence from one particular dataset establish compliance. Maps are evidence inputs, not substitutes for the complete due-diligence process.
For ParquetCanopy, EUDR provides the wider context for investigating how forest-related geographical data can be assembled, queried, and made available for further analysis.
3. A Landscape Described by Different Institutions
The project brings together geographical information from sources with different scopes and purposes. These include international forest-cover products, Thai government datasets, national forest-reserve boundaries, and global protected-area records.
GFC – Forest Cover for EUDR
The Global Forest Cover 2020 (GFC2020) product developed by the European Commission’s Joint Research Centre provides a global representation of forest presence and absence for 2020. It combines multiple datasets concerning tree cover, tree height, land cover, land use, and other relevant characteristics to produce a forest classification aligned with the FAO and EUDR definitions.3 Its downloadable raster data is distributed in geographical tiles rather than as one small, self-contained file.3
This introduces a different set of problems from working with administrative polygons. Raster datasets are organized as grids of cells; their geographical coverage is divided into tiles, and their interpretation depends on classification rules and spatial resolution. Working with regional subsets means understanding which tiles cover the area of interest, how their boundaries fit together, and how their spatial representation relates to the other datasets in the project.
GISTDA and MNRE – National Park Boundaries
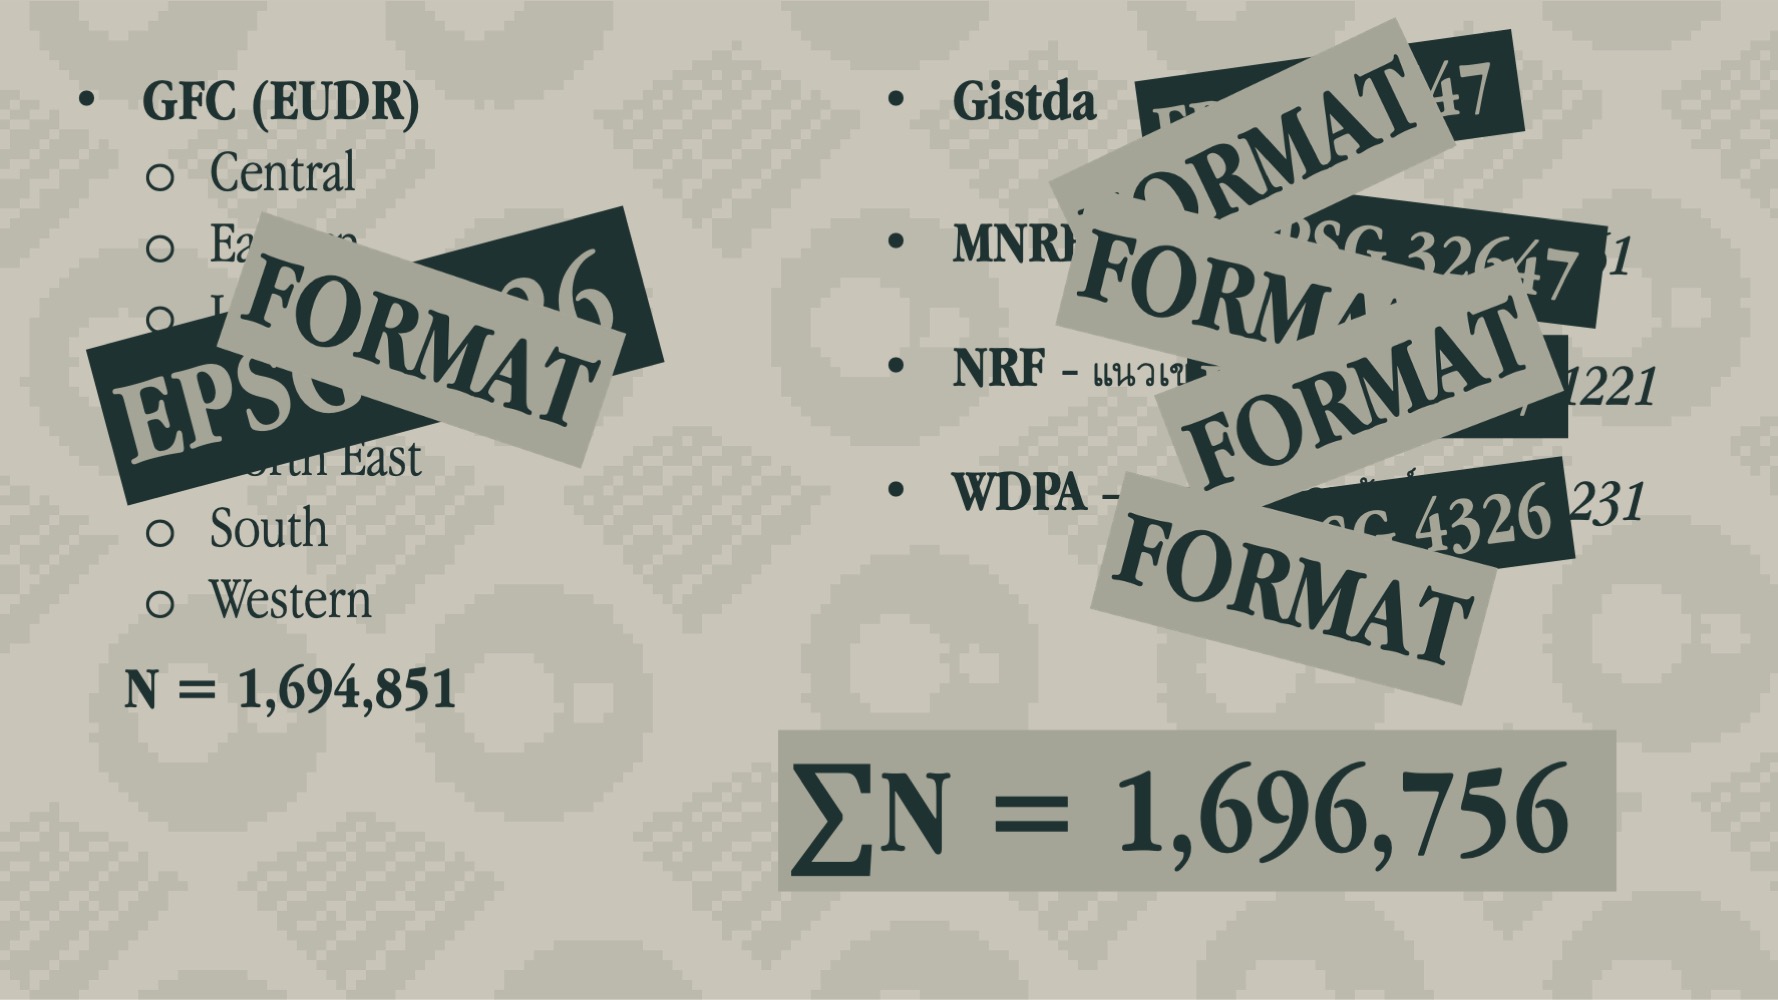
Thai government sources provide a more locally relevant view of designated areas. The project’s input datasets include national park boundaries associated with GISTDA and the Ministry of Natural Resources and Environment (MNRE). These boundaries describe designated areas rather than forest cover itself. Their significance lies in the geographical and administrative information they contribute to an investigation. A locally maintained boundary may also differ from a global dataset because of its source date, mapping scale, interpretation, or method of delineation. Rather than assuming that one version is universally definitive, the data pipeline must preserve enough source information to understand what each layer represents.
NRF – National Reserved Forest Boundaries
The National Reserved Forest (NRF) layer contributes another category of forest-related boundaries.National reserved forests, national parks, and areas identified as forest by a land-cover product do not necessarily have identical extents. They represent different concepts, and their geometries must be compared rather than assumed to coincide. The distinction matters when a spatial query is used to identify intersections, potential conflicts, or locations requiring further inspection.
WDPA – World Database on Protected Areas
The World Database on Protected Areas (WDPA), maintained by UNEP-WCMC in collaboration with IUCN and other data providers, supplies an international perspective on protected areas.4 Unlike a single national dataset, the WDPA brings together information from different countries, authorities, and providers. Its global coverage makes it useful for cross-regional analysis, but also means that its records must be interpreted in the context of their source and attributes. A protected-area boundary in the WDPA is not necessarily identical to the corresponding national boundary. Differences should be investigated rather than silently erased by merging the geometries.
One Working Collection, Many Representations
Across the project’s working data, the collection reached 1,696,756 area records. At this scale, seemingly minor inconsistencies become concrete engineering problems: a mismatched coordinate system, an unexpected geometry type, an inconsistent field name, or a duplicated boundary can affect the outcome of a query. The challenge is therefore not simply collecting more data. It is managing how the data relates to other data.
4. The Hidden Problem: Coordinate Reference Systems
Geographical data does not always describe locations in the same numerical coordinate system. One source may represent positions using longitude and latitude. Another may use a projected coordinate system, where locations are expressed as coordinates on a planar grid. Different projected systems may also use different datums, units, and projection parameters.
Two datasets can therefore describe the same physical location using entirely different coordinate values. This is not a cosmetic issue. Spatial operations depend on geometries being interpreted in compatible reference systems. Before two layers can be compared reliably, their coordinate reference systems must be identified and, where necessary, transformed into an appropriate common system. Merely assigning a new coordinate-system label to existing coordinates does not perform this transformation. The choice of target system also matters. Longitude and latitude are suitable for many forms of geographical representation, but straightforward calculations using angular coordinates do not directly produce areas in square metres. Area measurement and distance calculations require methods appropriate to the location and intended accuracy. The same care applies to geometry. Invalid polygons, unexpected geometry collections, multipart features, and inconsistent representations can complicate overlays and spatial joins. A spatial intersection is only as trustworthy as the coordinate systems and geometries that enter it.
5. Building a Common Analytical Foundation
The central work of ParquetCanopy is to make these heterogeneous datasets accessible to a common analytical workflow. The process can be understood as five connected stages.
First, inspect the source data. Each dataset must be understood before it is combined with anything else. This means examining its format, spatial extent, geometry or raster structure, coordinate reference system, attributes, source, and date.The goal is to establish what the data actually contains, rather than relying solely on the dataset’s filename or description.
Second, prepare the relevant geographical coverage.Regional tiles and separate files must be handled in a way that preserves their intended coverage. Relevant subsets can then be organized for the intended analysis. Raster and vector data require different treatment. A raster forest-cover product should not automatically be converted into millions of individual polygons merely to make it resemble a boundary dataset. The appropriate representation depends on the operations the system needs to perform.
Third, normalize the representations. Where the analysis requires datasets to interact, their coordinate systems, geometry types, and attribute schemas must be made compatible.This does not mean removing every distinction between sources. Original identifiers, provenance, source classifications, and relevant metadata should remain available so that a query result can be traced back to its inputs.
Fourth, organize the analytical data. Parquet provides a column-oriented format for storing suitable analytical datasets. DuckDB can query Parquet files directly through SQL, reducing the need to import every compatible dataset into a separate database before analysis.5 For ParquetCanopy, this provides a foundation for organizing prepared geographical data as files that can be queried through a common analytical layer. Not every source must be forced into Parquet. The format and any required conversion should follow the data’s actual structure and intended use.
Fifth, expose the service.FastAPI provides the application interface through which supported operations can be made available to other systems.This separates the analytical data layer from the service interface. Applications can request supported results without each having to implement the entire process of discovering, preparing, and querying the underlying files independently.
The resulting architecture is something like this => Source datasets → inspection and preparation → compatible analytical data → DuckDB → FastAPI → consuming applications

6. Why DuckDB, Parquet, and FastAPI?
Each component addresses a different part of the problem. Parquet provides a practical format for prepared analytical data. DuckDB supplies a SQL query engine capable of reading Parquet directly. FastAPI exposes the supported functionality through an HTTP interface.
Together, they separate data representation, computation, and application access. This architecture is particularly relevant when the main task is analytical access to prepared datasets rather than maintaining a conventional transactional database. It also leaves room to retain original sources separately and repeat preparation when a new data release becomes available. The approach has limitations. File-based analytical workflows require careful management of dataset versions, updates, and schema changes. Spatial operations still depend on compatible geometry representations and appropriate coordinate systems. Large or overlapping datasets may require explicit decisions about their intended semantics before an apparently straightforward query can be trusted. The software can execute a spatial operation correctly while the analyst has still chosen the wrong input layers. A technically valid intersection is not necessarily a meaningful environmental conclusion.
7. The Limits of the Map
Combining forest-cover data with protected-area boundaries can identify geographical relationships. It cannot independently establish every fact needed for environmental due diligence.
First, a mapped forest is not the same thing as proof that deforestation occurred after the EUDR cutoff date. That determination requires appropriate temporal evidence.
Second, a protected-area boundary does not by itself establish whether a particular commodity was produced legally. That question may depend on the applicable designation, jurisdiction, dates, permits, and other evidence.
Third, datasets can disagree. The disagreement may reflect positional uncertainty, different source dates, classification methods, legal definitions, or incomplete information. A workflow that automatically chooses one layer as authoritative risks concealing these differences rather than resolving them.
The more defensible approach is to preserve provenance, document analytical assumptions, and treat spatial results as evidence for further investigation. ParquetCanopy is therefore best understood as a geospatial data-service component. It provides a way to organize and query geographical information relevant to forest monitoring and risk assessment. It is not an automated verdict on the legality of a supply chain.
8. A System for Connecting Geographical Evidence
The project began with a practical observation: information about the same landscape is distributed across datasets that were produced for different purposes. An international forest-cover product, a national park boundary, a national reserved forest layer, and a global protected-area record may all be useful. None can simply substitute for the others. ParquetCanopy approaches this problem through a combination of data preparation, spatial interoperability, analytical querying, and service design. The result is a foundation for asking geographical questions across datasets without pretending that their sources, structures, or meanings are identical. The broader lesson extends beyond forests. Environmental analysis often depends on connecting information that was never designed to fit together in the first place.
The map is not the territory, and the data model is not the landscape. The engineering work is to connect them without confusing one for the other.
References
-
Food and Agriculture Organization of the United Nations (FAO). Global Forest Resources Assessment 2020. Read the report. ↩
-
European Union. Regulation (EU) 2023/1115 on deforestation-free products. Read the regulation. ↩ ↩2
-
European Commission, Joint Research Centre. Global Forest Cover 2020 – Data Access. Dataset and technical information. ↩ ↩2
-
UNEP-WCMC and IUCN. World Database on Protected Areas. Protected Planet. ↩
-
DuckDB documentation. Reading and Writing Parquet Files. Documentation. ↩